
Province-wide tool aims to inform services and policy
SAINT JOHN — A new online mapping tool developed by the Human Development Council is giving New Brunswickers a clearer view of income inequality and related social conditions across neighbourhoods, using 2021 census data to visualize patterns that local planners and service providers say are critical to day-to-day decisions.
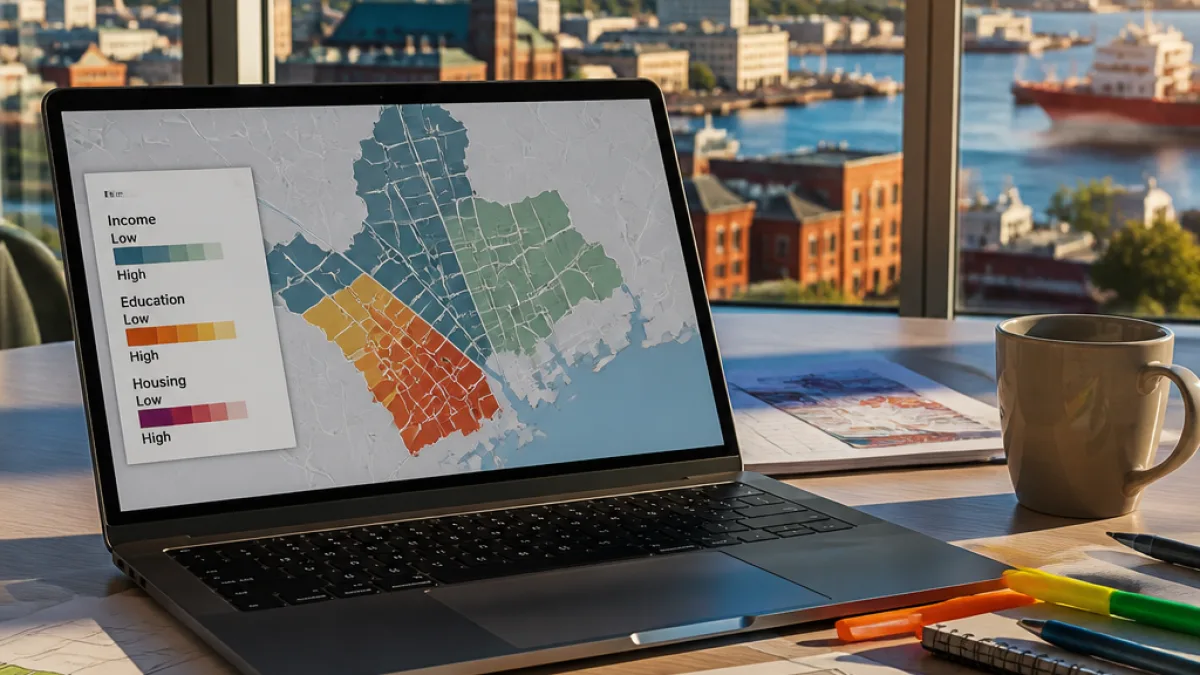
Launched earlier this month by the Saint John–based research group, the interactive map compiles a series of socio-economic indicators — including low income status, employment, education, family structure and housing — and displays how they vary between communities. Early takeaways point to consistent contrasts among suburbs, cities and urban cores.
“This kind of data is useful for a whole bunch of projects and work that goes on in a province,”
said Liam Fisher, the council’s data analyst and research co-ordinator. He said the tool is intended to support the many organizations that plan services based on place-specific needs rather than provincial averages.
What the map shows
The mapping project was led by summer intern Colin Ingraham and draws entirely on Statistics Canada figures. Rather than focusing on a single measure, the tool brings together multiple, correlated factors that frequently overlap in areas experiencing hardship.
| Indicator | What it captures |
|---|---|
| Low income status | Share of households below income thresholds |
| Employment | Labour force participation and joblessness |
| Education | Attainment levels across neighbourhoods |
| Family structure | Prevalence of one-parent families; children per household |
| Housing status | Share of renters and related housing dynamics |
| Age profile | Percentage of seniors in the local population |
Fisher noted the indicators tend to cluster. Areas with lower incomes often also report higher rates of unemployment or underemployment, more lone-parent households and greater proportions of renters.
“I think what the data clearly shows is poverty is not just the absence of income,”
Fisher said, adding that the social and economic pressures reflected in the map rarely show up in isolation.
How public agencies can use it
The council says the tool is designed for everyday use by community developers, municipal staff and non-profits. In particular, it can help refine where programs are placed and how resources are allocated, especially when budgets are tight and needs differ block to block.
- Regional service commissions: Community developers can identify neighbourhoods where indicators signal higher need.
- Cities and towns: Social inclusion teams can target programming, outreach and partnerships in specific areas.
- Non-profits and funders: Place-based data can guide grant applications, impact measurement and pilot projects.
Ingraham said the map’s goal is to make complex datasets accessible to people who plan services on the ground. By translating census tables into neighbourhood-level visuals, the tool supports evidence-based decisions without requiring specialized software or training.
Context: why neighbourhood-level data matters
Provincial and municipal averages can mask sharp differences within cities and towns. In New Brunswick’s three largest urban areas, the council’s analysis shows pronounced contrasts among suburban districts, downtown cores and surrounding neighbourhoods — patterns that can influence where to locate child care, employment programs, public transit improvements or seniors’ services.
Neighbourhood-level mapping has become a common planning tool across Canada, particularly for addressing affordability, health, and demographic change. The council’s initiative situates New Brunswick within that practice by providing a single, public-facing resource that combines multiple indicators in one view.
What comes next
The Human Development Council says the map will continue to support ongoing conversations about poverty reduction, housing and social inclusion. Because it rests on 2021 census data, the baseline is consistent across communities, offering a province-wide snapshot that practitioners can use immediately while monitoring trends over time as future data becomes available.
For now, the council encourages service providers, municipal departments and residents to explore the indicators most relevant to their communities and to consider how overlapping factors drive local outcomes. The map’s central message, Fisher said, is that effective responses to poverty and inequality require attention to the full picture — not just income alone.